Chronicle Services is a framework for building Event-driven microservices. Microservices built with Chronicle Services are efficient, easy to build, test, and maintain. Equally important they provide exceptional high-throughput and low latency. Monitoring and observability is a first class feature of the framework, and comes “for free” i.e. it requires no effort from the application developer, other than to turn it on.
Chronicle Services also provides features that take care of the hard stuff: low latency, HA/DR, determinism, state management and restart, allowing the developer to concentrate on their area of expertise – the business logic.
Below is an example graph of a mesh of interconnected services generated with the services visualisation tool. These services are a mix of pre-built services (from Chronicle EFX) and custom built.
This Chronicle Services demo application simulates a real use case – a basic market making system; it generates random price ticks and sends them to the Chronicle EFX aggregator, which sends aggregated books to the Pricer and mid-rates to the Position Server. The position server is also fed with execution reports from the FixTrading service, and sends position changes to the Pricer and the Hedger.
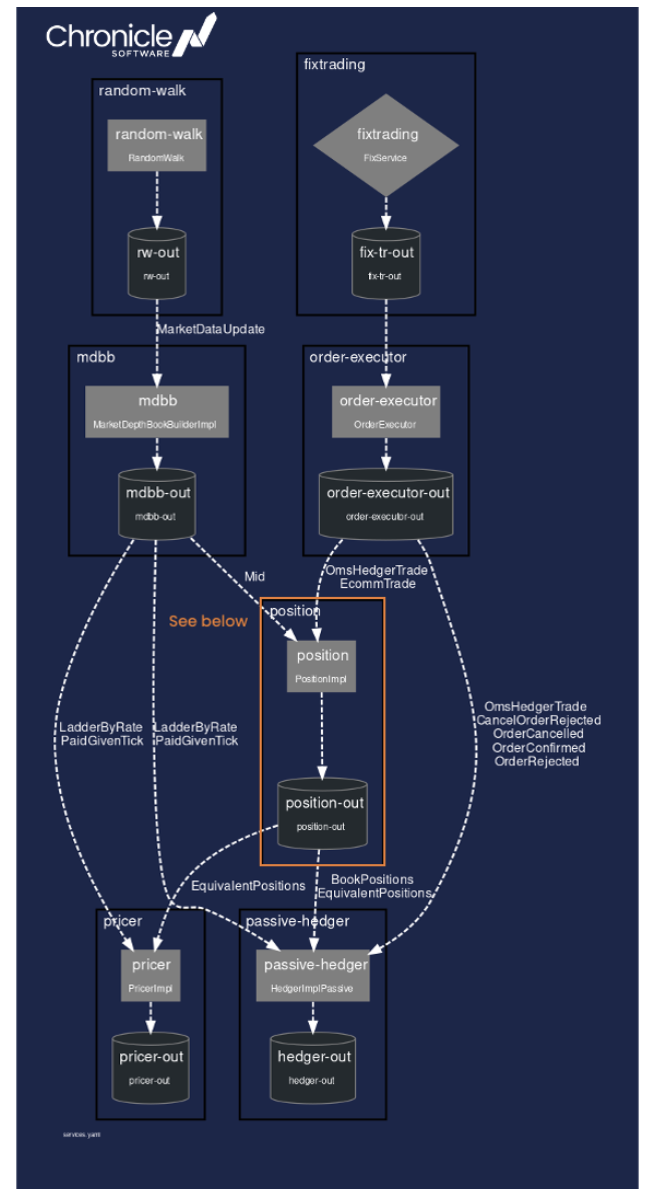
services architecture diagram
In the above generated diagram, you can see services (boxes), queues (cylinders), and the connections between components are labelled with message types, some of which have been excluded for clarity. Each service has exactly one output queue, and one or more input queues.
These services are configured in a simple YAML file – see extract below which represents the service highlighted in the diagram:
position: {
    inputs: [ order-executor-out, mdbb-out ],
    output: position-out,
    implClass: !type software.chronicle.efx.position.PositionImpl,
    heartbeatMS: 30000
    ...
}
Features
Chronicle Services comes with a number of features to reduce the burden on the application developer. These features come “for free” with the framework and the developer simply has to enable them, and the Chronicle Services IoC framework takes care of everything else.
As this article is focused on monitoring and observability, the features that help with this are:
- Heartbeating – this is aware of the services topology and runs in the background sending heartbeats and listening to responses. If a service is down, or any of its dependencies are down, the heartbeating capability notifies other services, and anything else that is interested e.g. monitoring tools
- Error recording and publishing – any errors generated by a service are captured and recorded and can be surfaced in a custom UI or monitoring tools
- Message rate and Latency measurement – sophisticated latency measurement is performed for each message and percentile histograms maintained. It is possible to drill down and see per-message, per-hop latencies
All of this monitoring and observability data are written to Chronicle Queues (Chronicle’s low latency event store) and are accessible to other services, custom applications, and monitoring tools.
Monitoring & Observability
In this article we are using Prometheus to store metrics and Grafana to visualise them. Both tools are widely used by our customers.
Chronicle Services reads heartbeat data, latency data and error data from the Services’ output queues and aggregates them for consumption by monitoring tools. To surface this output in a monitoring tool we use a gateway – and Chronicle Services ships with the prometheus-sender gateway which publishes these data to Prometheus.
We have used Chronicle Service’s visualisation tool to generate a new Services visualisation – in this case we have regenerated the service graph left to right, and with grafana’s colour palette. Chronicle’s grafana plugin surfaces the visualisation and colour codes the service and queue components, based on metrics queried from Prometheus.
In this you can see:
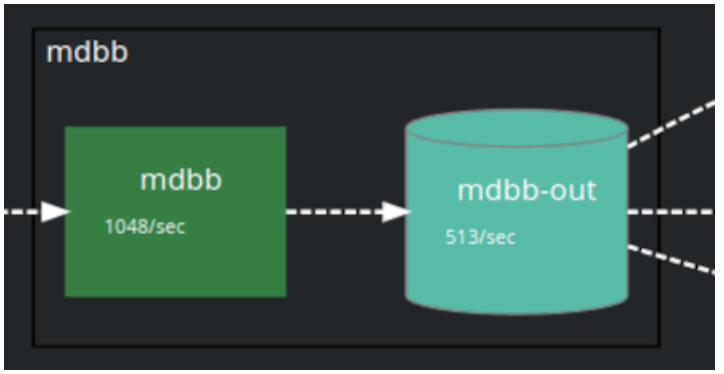
chronicle services and queues
- Services are coloured by their Heartbeat health – red/orange/green
- Queues are coloured by message rate – different shades of red/orange/green
- The actual message rates are displayed inside the box/cylinder underneath the service or queue, as are error rates (if any are being emitted)
Below we can see the visualisation of the services when everything is running happily. Note that any grey boxes do not have monitoring enabled. The highlight corresponds to the cut-out graphic above. In the real world this is displayed on a large monitoring screen, but is a bit hard to read in this document!
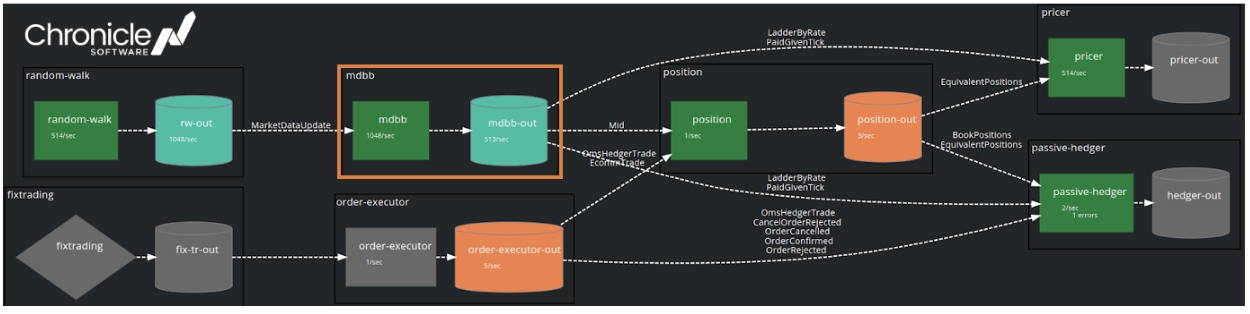
services visualisation
These metrics are exported live to Prometheus (and thus Grafana) so you can see an interactive visualisation of services’ health. The heartbeating functionality can be seen if you manually stop the position service – the position service goes red, its output queue indicates message rate has dropped to 0, and the position server’s downstream services have gone orange to indicate they are degraded.
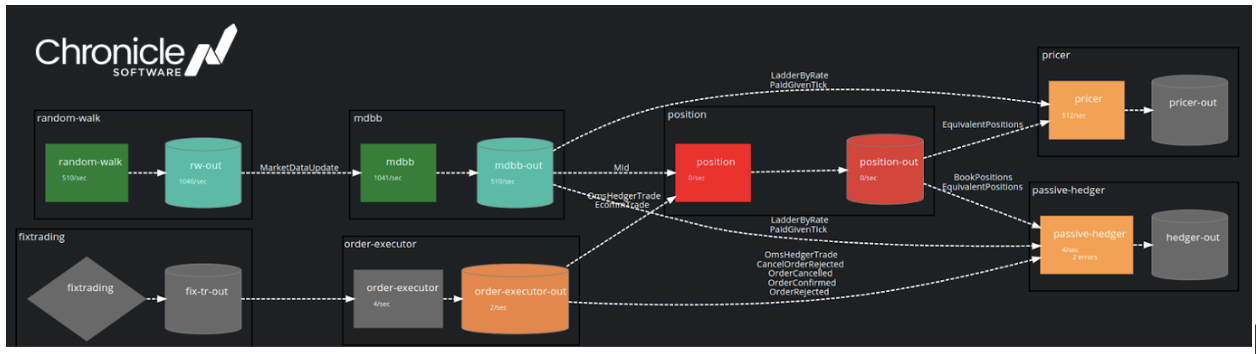
services visualisation
Chronicle’s Grafana plugin also shows latency and rate graphs. The position server was down from 14:26 to approximately 14:27 and this is reflected on the service by the red position service message rate line dropping to 0 on the graph below:
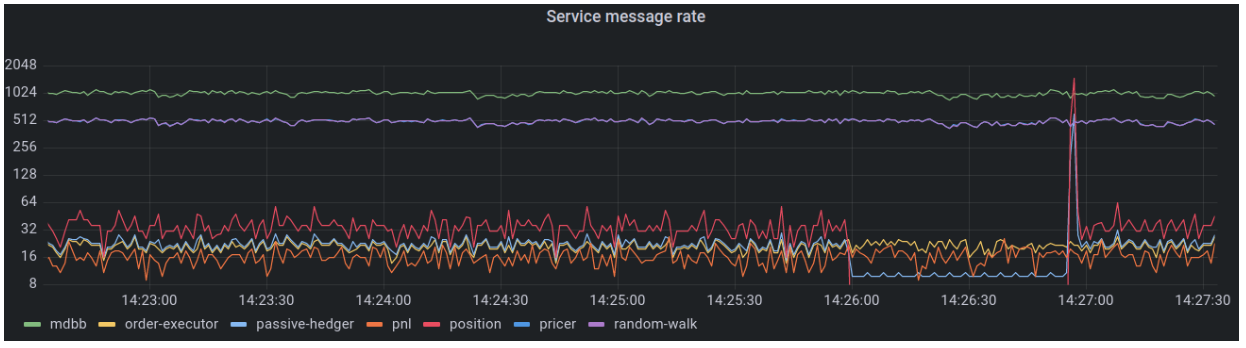
Grafana insights
And its position-out queue latency metric disappearing then coming back higher (while it warms up).
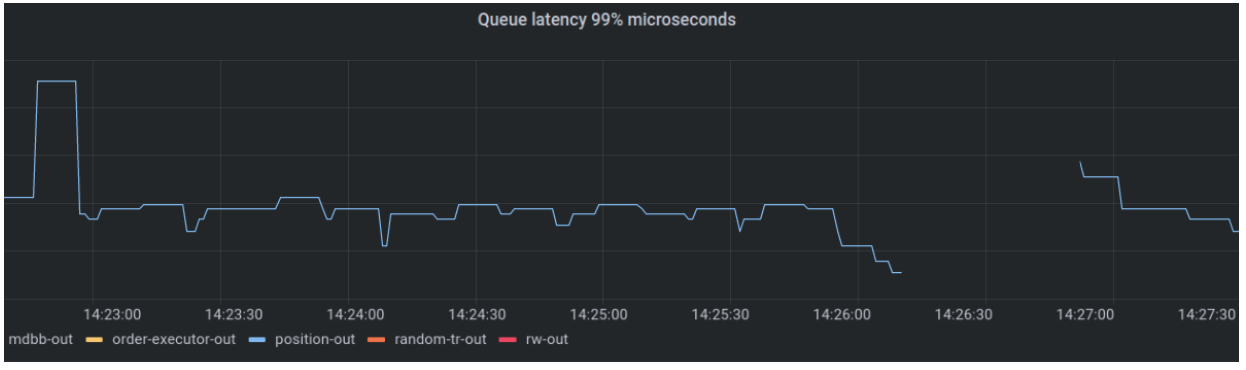
Grafana insights
The complete dashboard from this example looks like this:
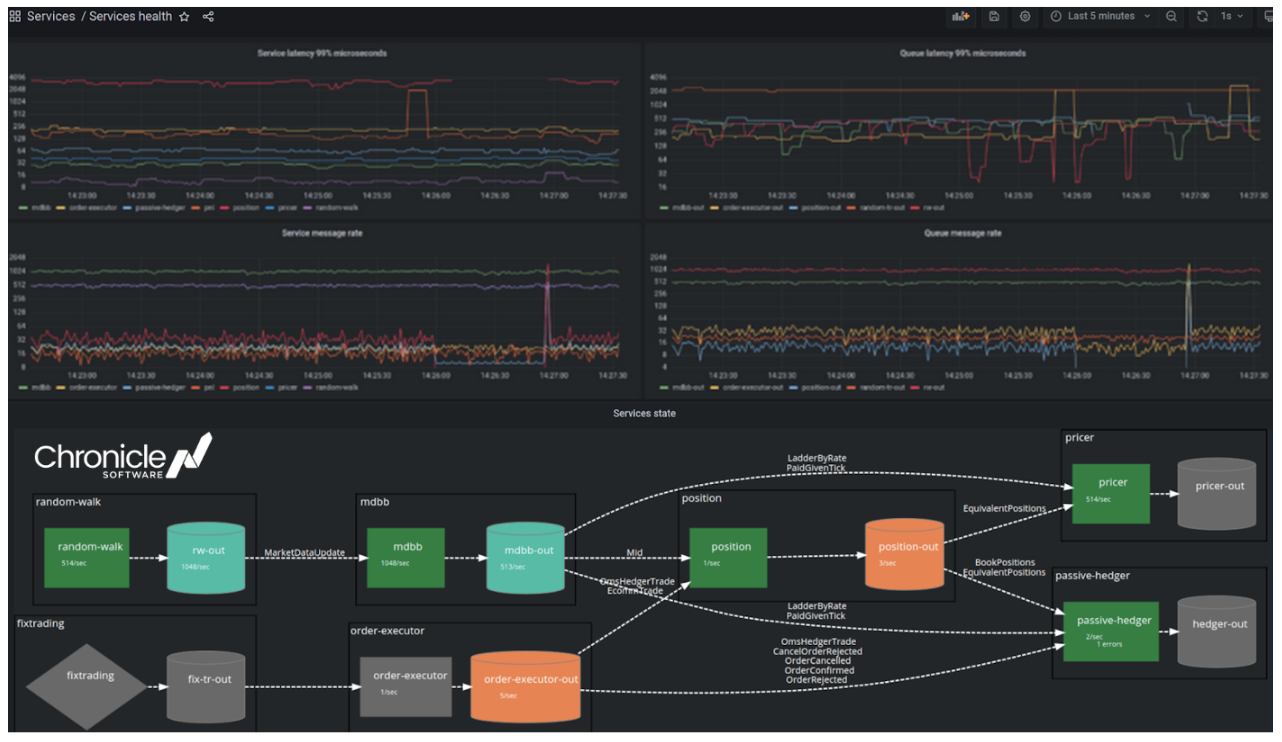
Grafana insights
Above you can see the last 5 minutes of service and queue 99th percentile latency, message rates, together with service health. The colours and numbers in the bottom panel show service health current state together with instantaneous message flow rates, and the graphs above show history, enabling visibility of the failed service discussed above.
Conclusion
Chronicle Services monitoring and observability features, together with the Prometheus gateway and the Grafana plugin, allow sophisticated monitoring dashboards to be built, and enable the business or ops teams to monitor service health and latency, thus empowering them to quickly see problems and proactively remedy issues.