24th February 2021
Overview
A common mistake in micro-benchmarking is to use performance tests that are wildly optimistic. Most benchmarking tools focus on throughput performance and report an average latency. However, when the same code is run in production, results can be dramatically worse. A problem with benchmarking using average latency is that it does not effectively reveal the problem of high tail latency. For example, an application can have good latency for 99% of the time, but the latency in the 99th percentile might be hundreds of times higher than the average latency. This can cause high performance applications that require low latency to randomly fail to produce the results required by customers, resulting in dramatic and damaging problems.
What are some of the causes and how can we simulate them so we can optimise for these poor performing scenarios?
What are Trivially Copyable objects
The idea of Trivially Copyable Objects comes from the C++ community. It refers to an object that is made up entirely from primitive fields. Using trivially copyable objects is desirable as it allows us to serialize the object by doing a single memory copy. As you can imagine this approach is much more efficient than other forms of serialization, such as Marshallable or Java serialization, which iterates through (usually using reflection) all the fields of a class, serialising each field in turn, recursively walking down the object graph. Trivially Copyable Objects don’t have to be serialized in this way, as they are able to be copied with a single memory copy, which is much more efficient.
The benchmark
In this article we’ll look at the time it takes to serialize and deserialize a New Order Single with just 12 fields, including two text fields and two date/time fields. A New Order Single is a common FIX message type.
A number of different ways of serializing the same data are compared. More importantly, different ways of benchmarking them are also compared: you will see that how software is benchmarked can change the result dramatically.
In general, you want the serialization which is the most tolerant for schema changes that will perform with sufficient quickness. There is no point working with a difficult to maintain serialization if an easier one would also be suitable.
For the purpose of this discussion, let’s say you are looking for a solution that can write and read this object in under 10 microseconds. How does the method of testing yield different conclusions?
What are the different ways of serializing the data?
Java Serialization
I have included Java Serialization for comparison. Any decent serialization library should be faster, as Java Serialization tries to be as general as possible, but it also has a number of historical restrictions. The performance is acceptable, but just about any other way of serializing is likely to be faster (XML being the only widely used exception I have found)
JSON Serialization
JSON is a portable text format which can be reasonably efficient, can outperform Java Serialization, and is somewhat human-readable and more portable between languages.
Self-describing binary format
Chronicle Wire supports a more efficient binary version of YAML (a superset of JSON which includes support for types).
Raw Binary format
This format includes no meta-data, which is highly efficient–but raw binary format is less flexible for addressing schema changes.
Trivially Copyable
This format is the lowest level and involves a raw memory copy to/from the Java object. It is the most brittle, but also the fastest, as it involves the least machine code and memory operations.
Throughput (average latency) test
This test is often used in marketing benchmarks because it offers the best results. It is good for hiding significant delays due to high tail latency. However, unless your system is designed for large batch processing, it usually produces results too optimistic to be useful.
JMH version 1.27 was used with 3 forks, 3 iterations, 3 threads of 5 seconds each (with at least 2.5 million samples in each case)
This shows the average latency in microseconds. For the purposes of our 10 microsecond limit it looks like any of these approaches would be suitable.
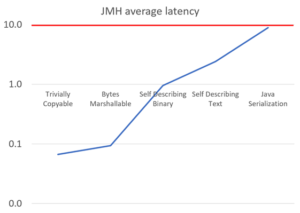
Note that the benchmark test only performs the serialization/deserialization in a tight loop, and does nothing else. In real programs, other code is also run, so the code in question can’t run as efficiently.
Sampling the typical && 99th percentile latency.
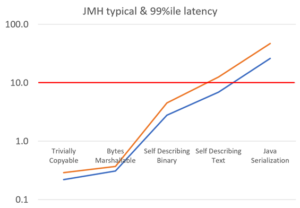
JMH also supports timing each task individually and looking at the latency histogram. This means performing a small amount of work between each task. As we will see, what you do before running some code can have a significant impact on how fast that code runs.
All our results are 2.9 to 3.3 times worse just by changing how the timings are sampled. The 99th percentile, in orange, averages 1.5 times the typical latencies
A short busy waiting delay
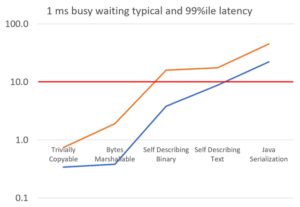
In most trading systems, there is a short delay between events. In order to minimise the impact of a CPU cooling/powering down, busy waiting is used. However, even busy waiting can result in code performing slower after even 1 millisecond of busy waiting. This translates to an event rate of 1,000 per second. If your trading system is getting lower event rates than this, the impact can be even higher.
Busy waiting for 1 millisecond increases the typical latency by around 23% and the 99%ile latency by around 129%.
The CpuCooler tester in Chronicle Core was used to perform different operations between timed tests to see how those operations cause the tasks to slow down. Some CpuCoolers simulate disturbing the CPU caches, and add busy waiting or pausing delays.
Blocking IO and pausing
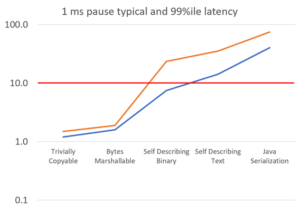
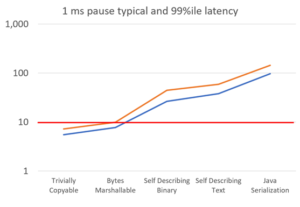
A simple way to simulate the impact of a blocking IO call, or a context switch, is to pause for 1 millisecond instead of busy waiting. In this situation your power management choices can impact how slow the code is after waking up and returning from a system call.
Pausing for 1 ms rather than busy waiting for 1 ms increased the typical latencies by 144% and the 99%ile latencies by 159%
Blocking IO and pausing on a bare metal machine without tuning power management
The worst combination, which is unfortunately one of the most common, is to use blocking IO without tuning the power management to minimise latency. This results in code which is very slow after waking up.
Without power management tuning, the typical latency was around 246% higher and the 99%ile 172% higher again.
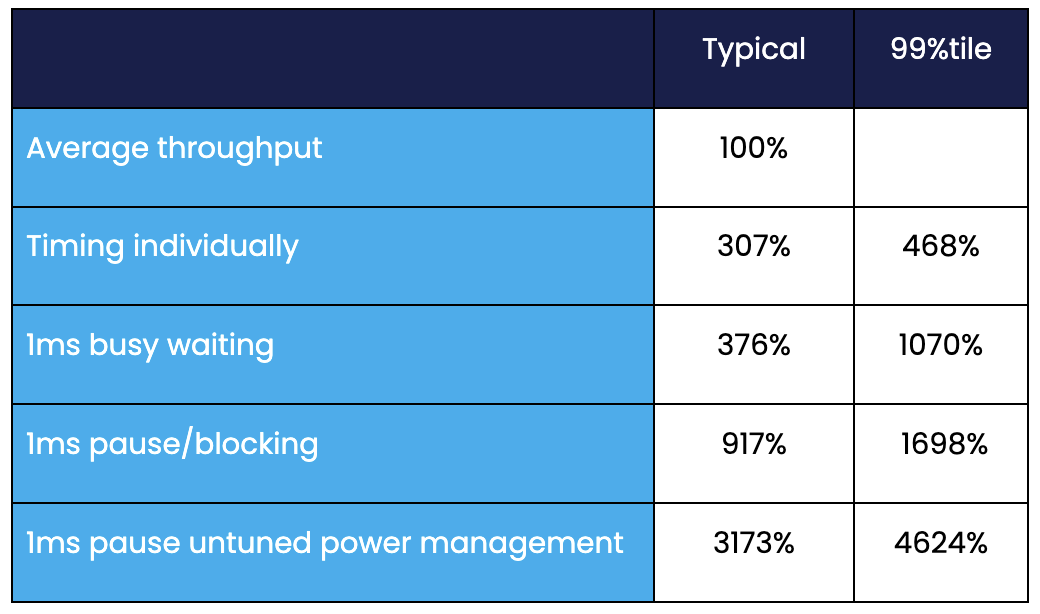
Approximate slow down by testing method
How the code is tested changes the time the code takes to run dramatically. Unfortunately, the higher results tend to be closer to what we see in low latency trading systems, especially those with low throughputs of 1000 events per second or less.
Conclusion
A superficial micro-benchmark might suggest that any serialization is suitable; however, when you use it in production you might find that only the most efficient serialization meets your latency requirements. While a throughput benchmark, which is often used in marketing, might suggest an approach that is suitable, you might not see this performance in production, making it difficult to simulate in development and testing.
The open source library, Chronicle Wire provides the flexibility to trade off ease of use for performance as needed. It is up to 100x faster than Java Serialization for the same information, however even the human readable data can be 5x faster. The source is available here https://github.com/OpenHFT/Chronicle-Wire
Broadly speaking, the shape of the graph comparing relative performance by the different serialization techniques reveals that the meaning of a micro-benchmark can be a good indicator of relative performance, but in terms of the absolute performance you will get, serialization benchmarking can predict a very different result from what the actual performance of a production trading application will be.
Want access to exclusive Chronicle content?
Hit the button below and join the Chronicle Community on LinkedIn, for free! You'll get exclusive access to blogs, guides, and video content. Join today!