
The Chronicle Services framework provides features that take care of the hard stuff: low latency, high availability/ disaster recovery (HA/DR), determinism, state management and restart, and allow the developer to concentrate on their area of expertise - the business logic.
Chronicle Services comes with a number of features to make the application developer’s life easier - some of these are:
Heartbeating - this is aware of the services topology and notifies services and monitoring tools if a service is down, or any of its dependencies are down.
Error recording and publishing - any errors generated by a service are captured and recorded and can be surfaced in a custom UI or monitoring tools.
Message rate and latency measurement - sophisticated latency measurement is performed for each message and percentile histograms maintained. It is possible to drill down and see per-message, per-hop latencies.
All of this data are written to Chronicle Queues and are accessible to other services, custom applications etc.
Metrics
The MonitorService can be installed in the configuration file ie services.yaml and will capture and aggregate metrics for all the output queues it listens to. On every periodic update this service generates:
summary of heartbeat health of each service
count of application errors since last periodic update
count of messages seen by service and queues
latency stats for each service and each input queue
See example below:
...
    monitoring: {
      inputs: [
        monitoring-in,
        order-submission-out,
        trade-publisher-out,
        ...
        position-out,
        mdbb-out,
      ],
      output: monitoring-out,
      pauser: balanced,
      startFromStrategy: END,
      implClass: !type software.chronicle.services.monitor.MonitorService,
      periodicUpdateMS: 1000,
      aggregate: 10
    },
...
The above will listen to the output of the four services outputting to the *-out queues and generate aggregate metrics into monitoring-out. These outputs can then be read by another service which will then send them to a third party monitoring tool via a gateway.
Monitoring Services Using Prometheus
Prometheus is an open-source systems monitoring and alerting toolkit. The PrometheusGateway listens to the output from MonitorService and send to Prometheus. An example of how to install is below:
...
    prometheus-gw: {
      inputs: [ monitoring-out ],
      output: prometheus-gw-out,
      pauser: balanced,
      startFromStrategy: END,
      implClass: !type software.chronicle.monitorgateway.prometheus.PrometheusGateway
   },
...
This service outputs to a number of Prometheus gauges:
service_latency_us
queue_latency_us
queue_msg_rate
service_msg_rate
error
health
Example Output
When surfaced in grafana, the output from the Prometheus gauges looks like this:
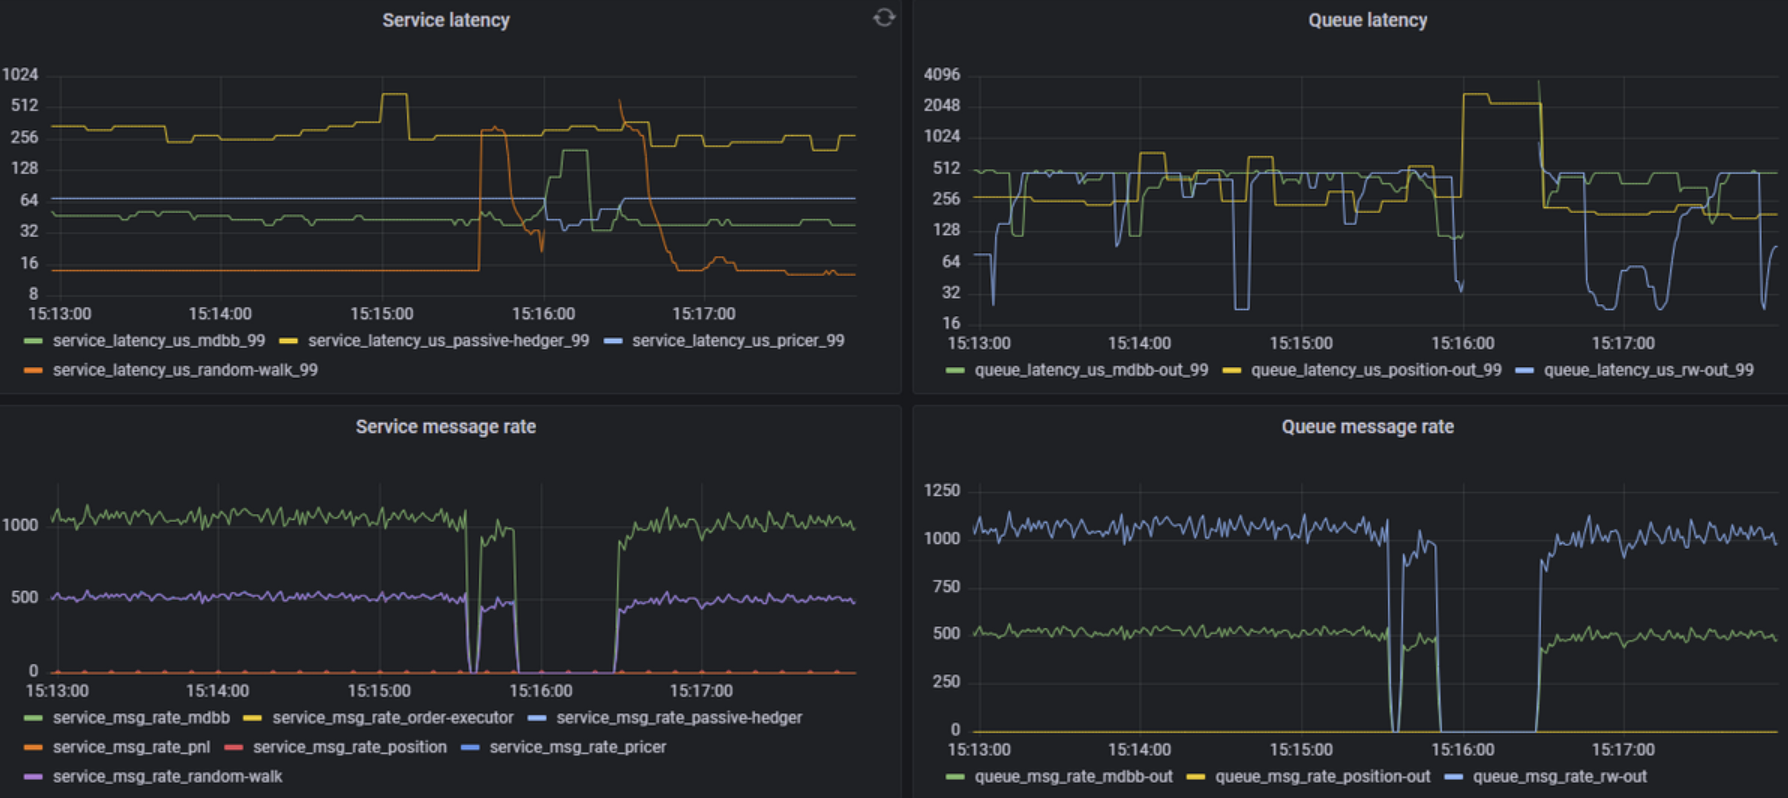
Figure 1. Latency and message rate
And the service health output can be seen with individual services colour coded below:
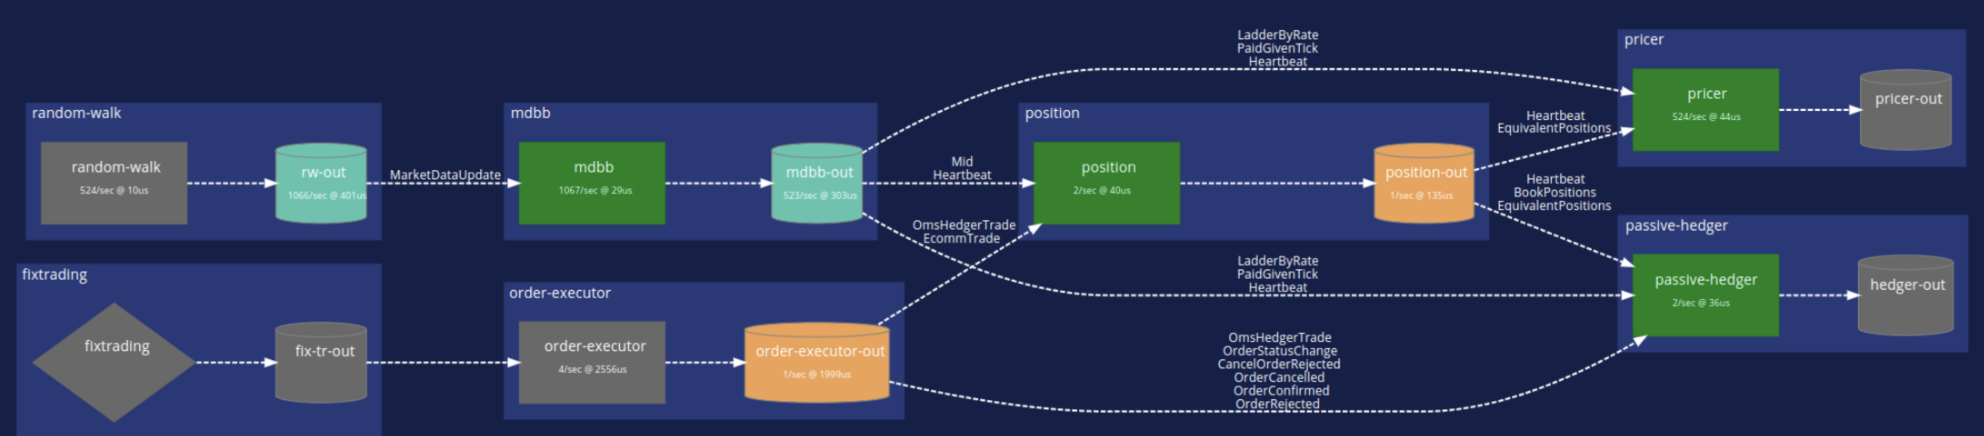
Figure 2. Demo scope services in grafana
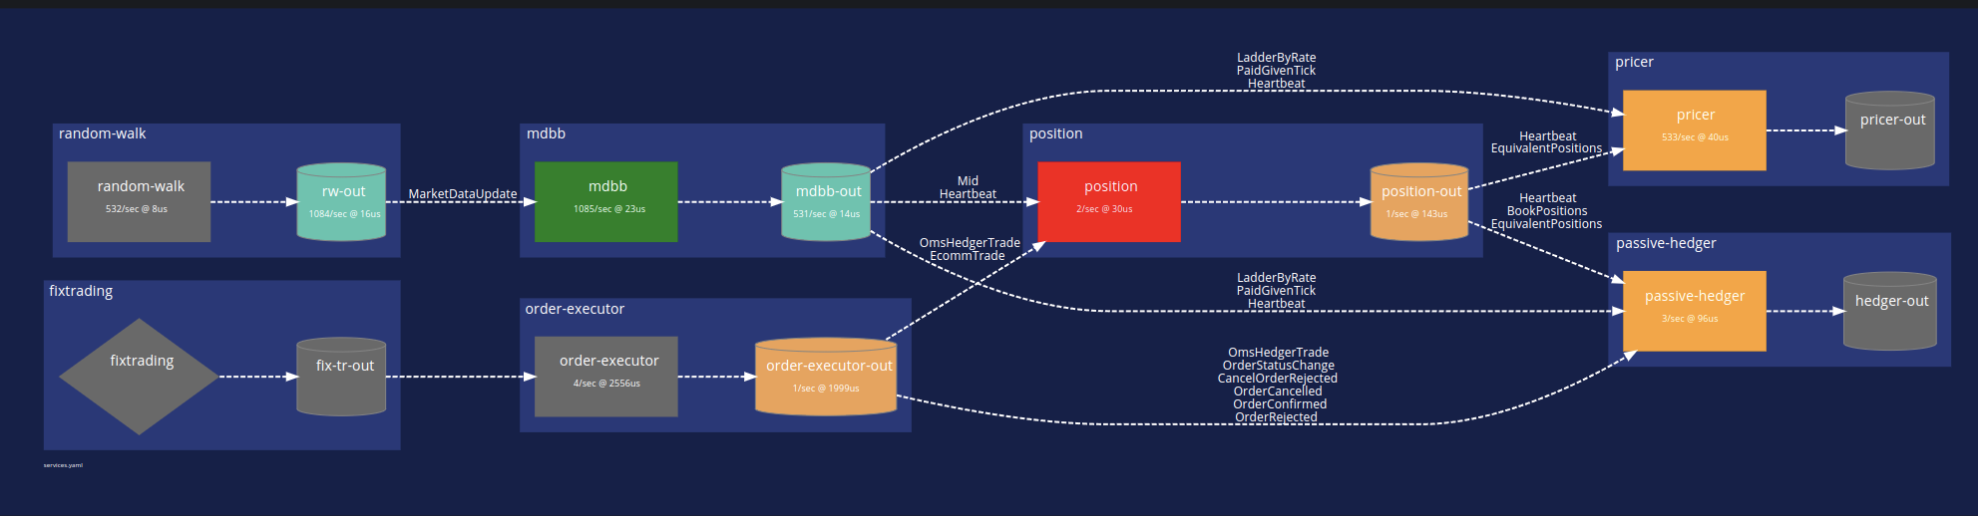
Figure 3. Position service down