Monitoring and Control
Chronicle FIX provides a comprehensive suite of monitoring, control, and testing tools for both offline and online inspection.
FIX Message Parser UI: A free-to-use FIX parser that displays FIX messages in a human-readable format, serving as a tool for testing and inspection.
Session Monitoring: Enables logging of connection information at various detail levels. Data is logged in a Chronicle Queue and can be accessed by other applications, both online and offline, for visualization or analysis. Accessing information in the monitoring queue does not impact engine performance.
Performance Monitoring Probes: Records the exact timing of events such as reading, parsing, and publishing messages during normal engine operation. These records are useful for performance testing and monitoring.
Command Line Tools: Classes for reading FIX logs, dumping messages from log queues as YAML, replaying messages, and troubleshooting.
Troubleshooting Log: Chronicle FIX can be configured to log FIX messages to the console for debugging and troubleshooting purposes.
Chronicle FIX supplies the following monitoring, control and testing tools which can be used for offline and/or online inspection.
FIX Message Parser UI: This is a free-to-use FIX parser, which can display FIX messages in a human-readable format. It serves as a tool for testing and inspection of FIX messages.
Session Monitoring: This tool enables logging connection information at different levels ie, with different details. The information is logged in a Chronicle Queue and can be accessed by other applications, online and offline, for example to visualise the information. Accessing the information in the monitoring queue has no impact on performance of the engine.
Chronicle FIX can be configured to log connection information per session at the following levels:
NONE: monitoring is disabled. This is the default configuration.
SESSION: monitors which sessions have been created, and their connection status.
NETWORK: SESSION plus TCP network status
LATENCY: NETWORK plus session latencies
As mentioned, connection information is logged to a Chronicle Queue which can be accessed by other applications (eg Splunk), without impacting performance of the FIX engine. The default location of the monitor queue is the "monitor" directory but this is configurable. By default, the information is logged to the monitor queue every 10 seconds, after an initial delay of 30 seconds, however these can be also be configured.
Session latency is output separately for each session and is calculated using the Chronicle FIX probes mechanism.
Histograms contain: 50%, 90%, 99%, … 100% as a minimum with … filled in with 99.7%, 99.9%, 99.97% if there is enough data. All numbers are in nanoseconds.
Performance Monitoring Probes: The exact timing of events such as reading, parsing and publishing a message that happen during normal operation of the engine can be recorded using the provided probes. The records can be useful for performance tests or monitoring.
Command Line Tools: These are classes used for reading FIX logs, dump messages in log queues as YAML, replay messages and troubleshooting etc.
Troubleshooting Log: Chronicle FIX can be configured to log FIX messages for debugging/troubleshooting on the console.
Learn more about our monitoring and control capabilities here.
Integration with Third-Party Monitoring Tools
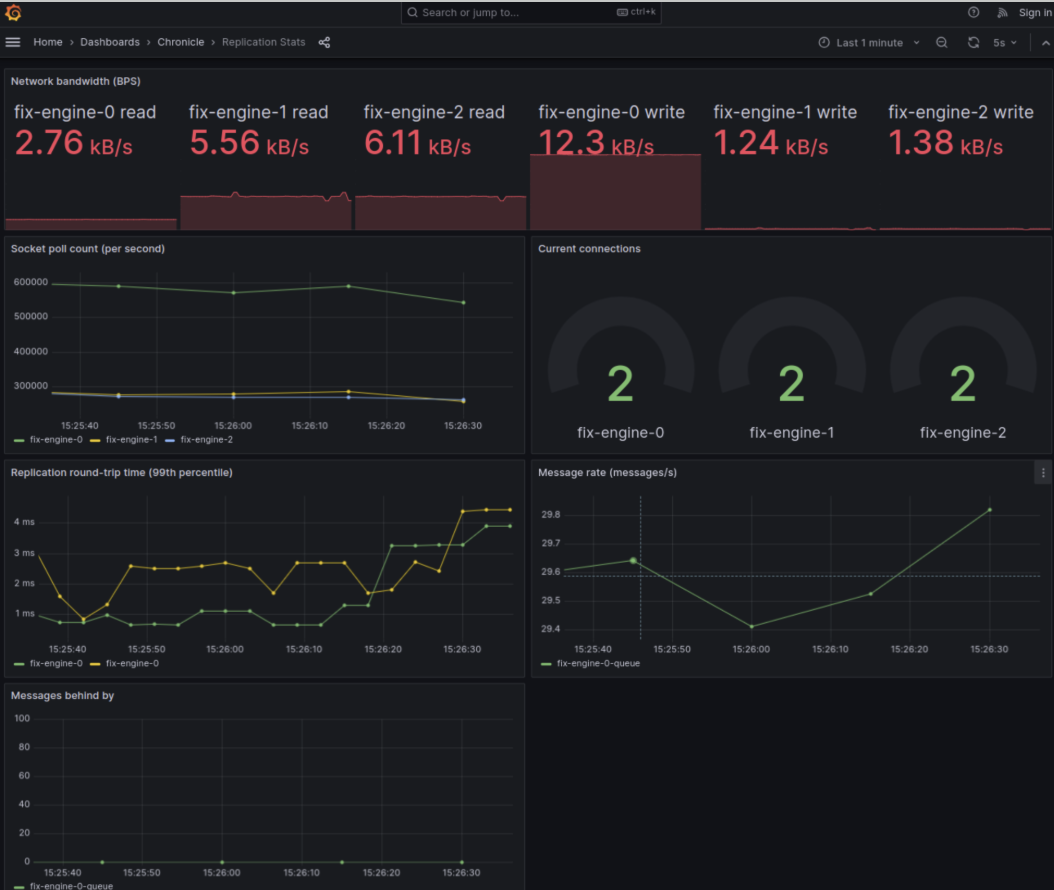
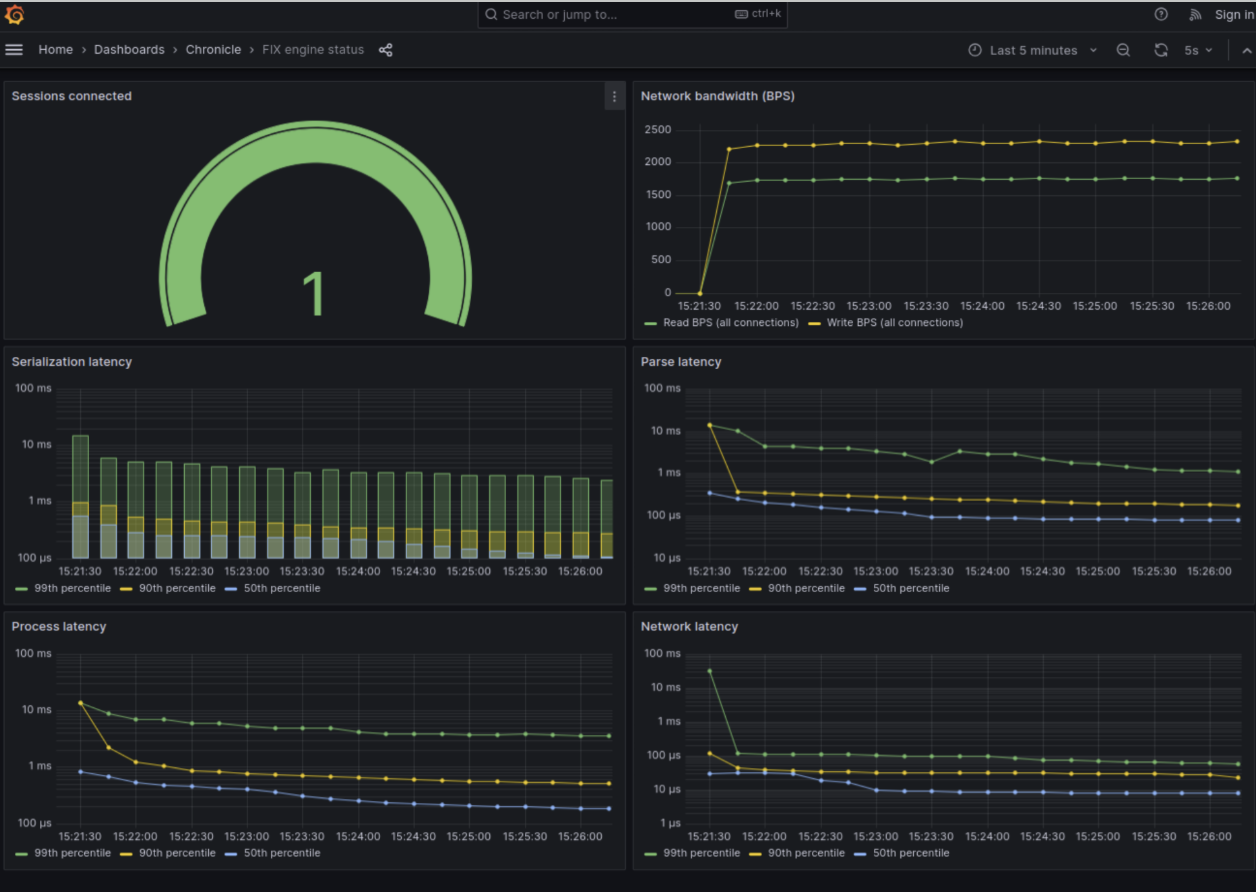
Chronicle FIX can be integrated with third-party monitoring and observability platforms such as Grafana, allowing teams to visualise session data, latency metrics, and performance insights within their existing monitoring infrastructure. The below illustrate an example Grafana integration.