
Kafka Latency Benchmark: Kafka vs Chronicle for Microservices
See how Kafka and Chronicle Queue compare on end-to-end latency, throughput and heap usage and why our benchmark measured Kafka latency up to 750x higher.
January 5th, 2022
Apache Kafka is a popular choice for inter-service communication. It supports parallel message processing and excels at log aggregation. Kafka advertises low latency and high throughput, but is it fast enough for latency-sensitive microservices in the cloud?
Chronicle Software created Chronicle Queue Enterprise to deliver microsecond latency. Banks worldwide now rely on it in trading platforms and real-time streaming applications. This article compares Kafka and Chronicle Queue, showing where Kafka’s throughput and latency fall short and why Chronicle Queue can be up to 750 times faster while handling five times the load.
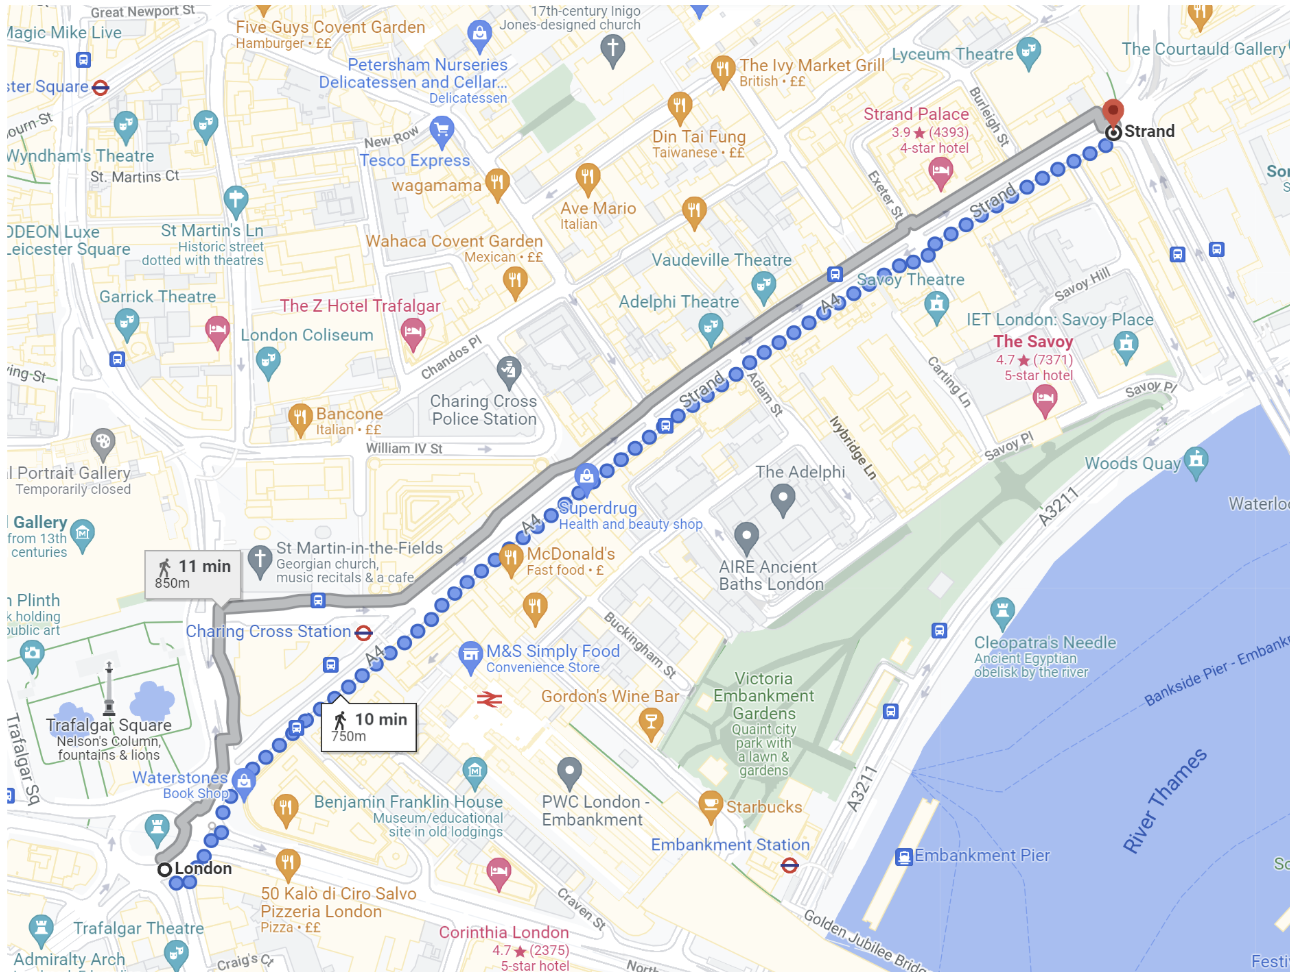
Visualising Delay as Distance
Light travels through fibre or copper at roughly two-thirds the speed of light in a vacuum. Viewing latency as the distance a signal can cover in a given time helps illustrate performance differences, especially for systems spanning data centres.
Microservice latency with Chronicle
The 99th-percentile end-to-end latency for Chronicle Queue Enterprise at 500 k msg/s is 3.69 µs, equivalent to a signal travelling about 750 m – roughly a 10-minute walk in central London.
Microservice latency with Kafka
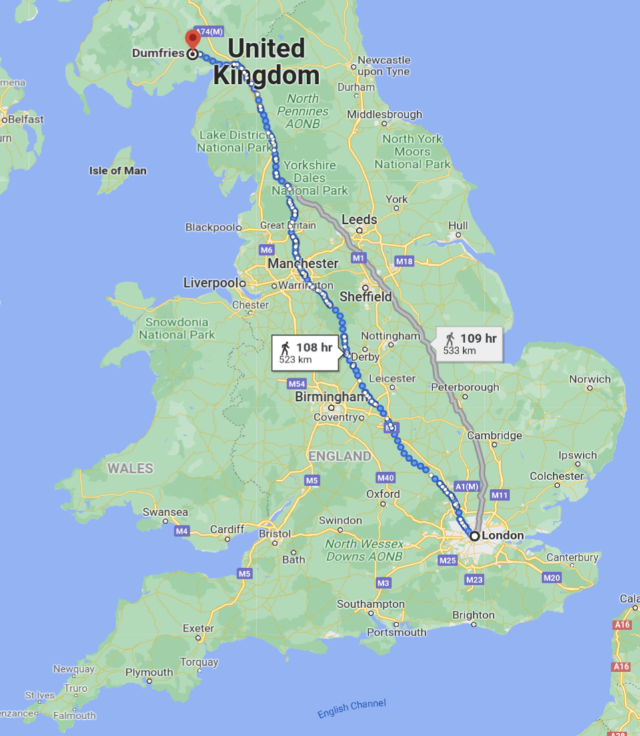
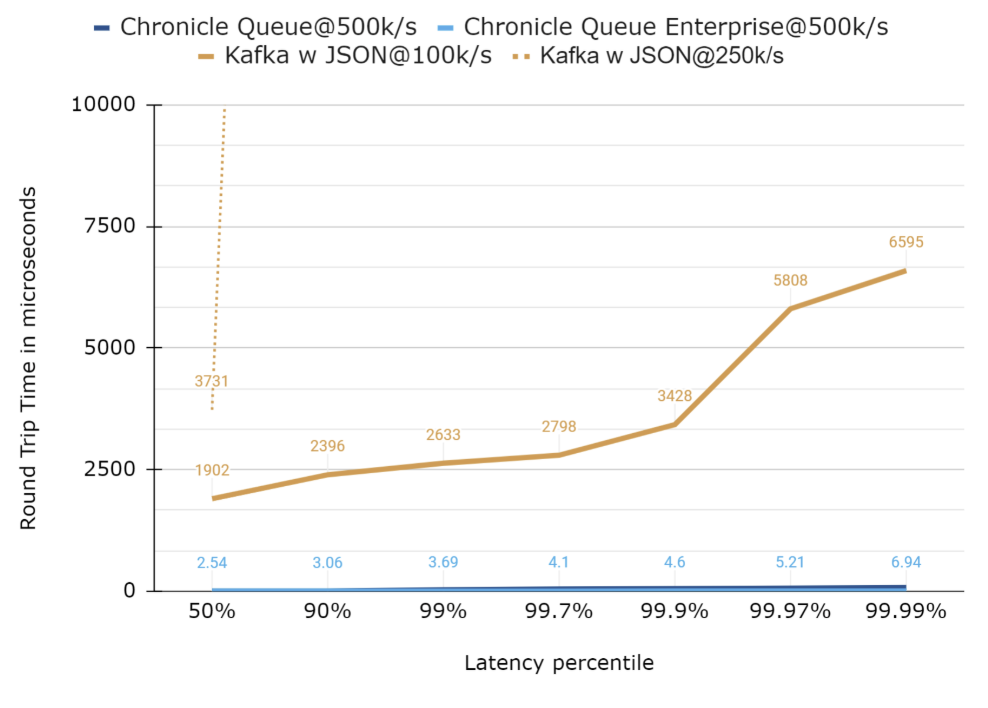
Running Kafka at 100 k msg/s yields a 99th-percentile end-to-end latency of 2 633 µs. That equals a signal travelling 526 km – a distance from London to parts of Scotland, a journey of more than 100 hours on foot. Above 150 k msg/s Kafka latencies rise steeply.
Log aggregation: Kafka’s sweet spot
Kafka was built for log aggregation and, with its extensive connector ecosystem, performs well in that role. Tests show Kafka can outperform traditional file-based logging while improving manageability (see https://docs.confluent.io/cloud/current/client-apps/optimizing/latency.html).
Test scenarios
All benchmarks ran on a Ryzen 9 5950X with Ubuntu 21.04 and an MP600 PRO XT 2 TB NVMe drive.
• Chronicle Queue OS v5.22ea14 at 500 k msg/s (Chronicle Wire serialization)
Single producer, single consumer
Command: -Dworkload=500kps.yaml chronicle.yaml
• Chronicle Queue Enterprise v2.22ea72 at 500 k msg/s, Asynchronous buffer
Single producer, single consumer
Command: -Dworkload=500kps.yaml chronicle-async.yaml
• Kafka 3.0.0 + Jackson JSON at 100 k msg/s, high-throughput latency profile (linger.ms = 1)
Four partitions, eight consumers
Command: -Dworkload=100kps.yaml kafka.yaml
• Kafka 3.0.0 + Jackson JSON at 250 k msg/s, same profile
Four partitions, eight consumers
Command: -Dworkload=250kps.yaml kafka.yaml
Notes
• Partition and consumer counts reflect configurations that produced the best 99.99th-percentile latencies.
• Chronicle Queue performance is largely insensitive to publisher and consumer counts; one publisher, one consumer and one microservice were sufficient at both 100 k msg/s and 500 k msg/s.
• Kafka at 500 k msg/s suffered severe queuing; a two-minute burst pushed typical latency toward one minute.
• Kafka required at least four consumers to reach 250 k msg/s; eight offered marginally better results.
• Kafka’s low-latency setting (linger.ms = 0) failed above 25 k msg/s from a single producer.
Publish latency
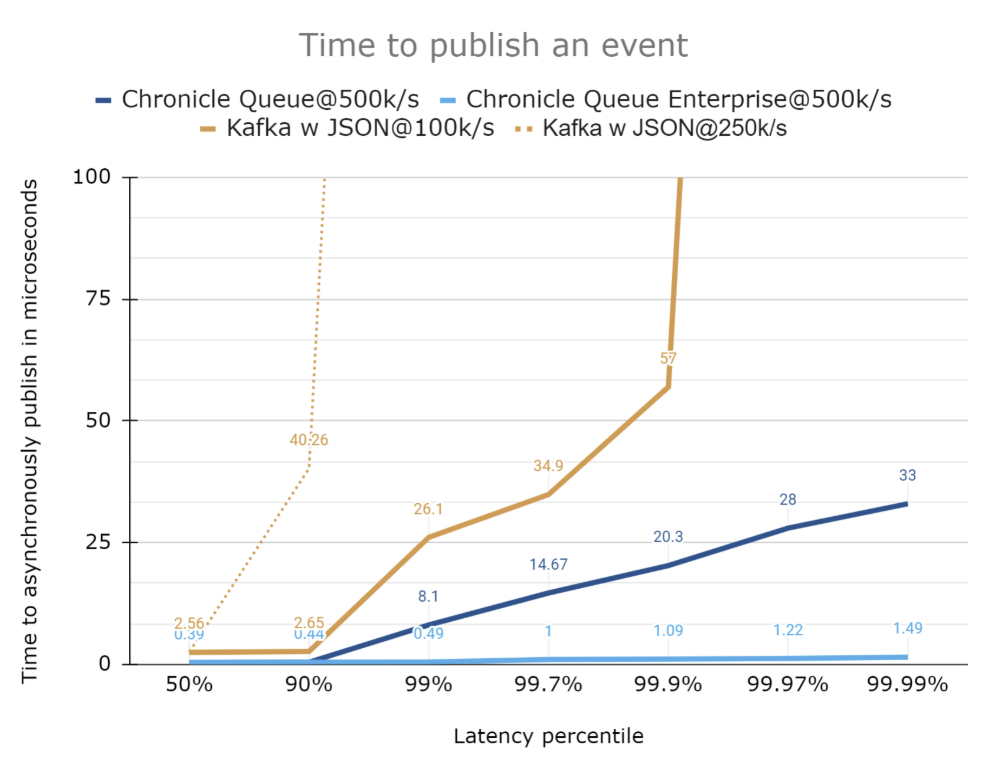
Typical publish latencies were similar across all tools – under 2.6 µs – but Kafka’s outliers were significantly higher. Each test used 512-byte JSON events with two timestamp fields for tracing.
Microservice messaging transport
Microservices care about total round-trip time from event creation to downstream consumption. The benchmark measured:
Add high-resolution timestamp (System.nanoTime())
Serialize first message
Publish first message
Consume and deserialize first message
Invoke microservice
Add second timestamp
Serialize response message
Publish response
Consume and deserialize response
Record end-to-end latency
Each request generates a response, doubling message count versus a single-hop test.
Kafka’s own benchmarks
Confluent reports 99th-percentile end-to-end latency of 5 ms for a single hop with replication (https://www.confluent.io/blog/kafka-fastest-messaging-system/). Our two-hop test at 100 k msg/s out and 100 k msg/s back should deliver similar aggregate load, yet Kafka still spends milliseconds in transit.
End-to-end latency comparison
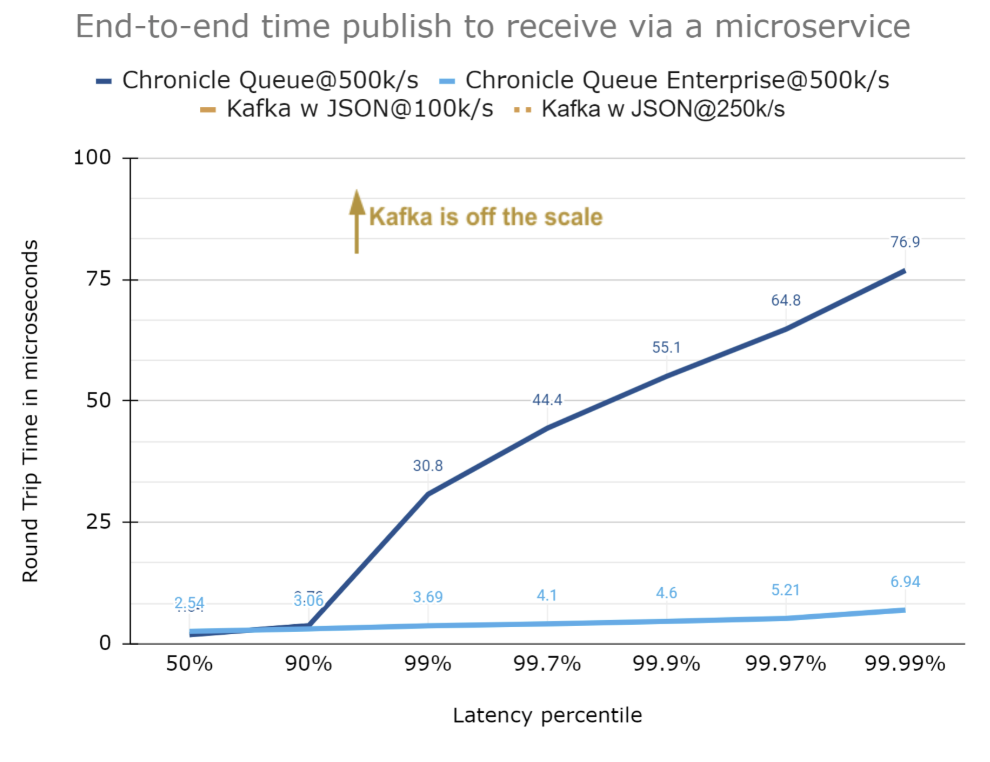
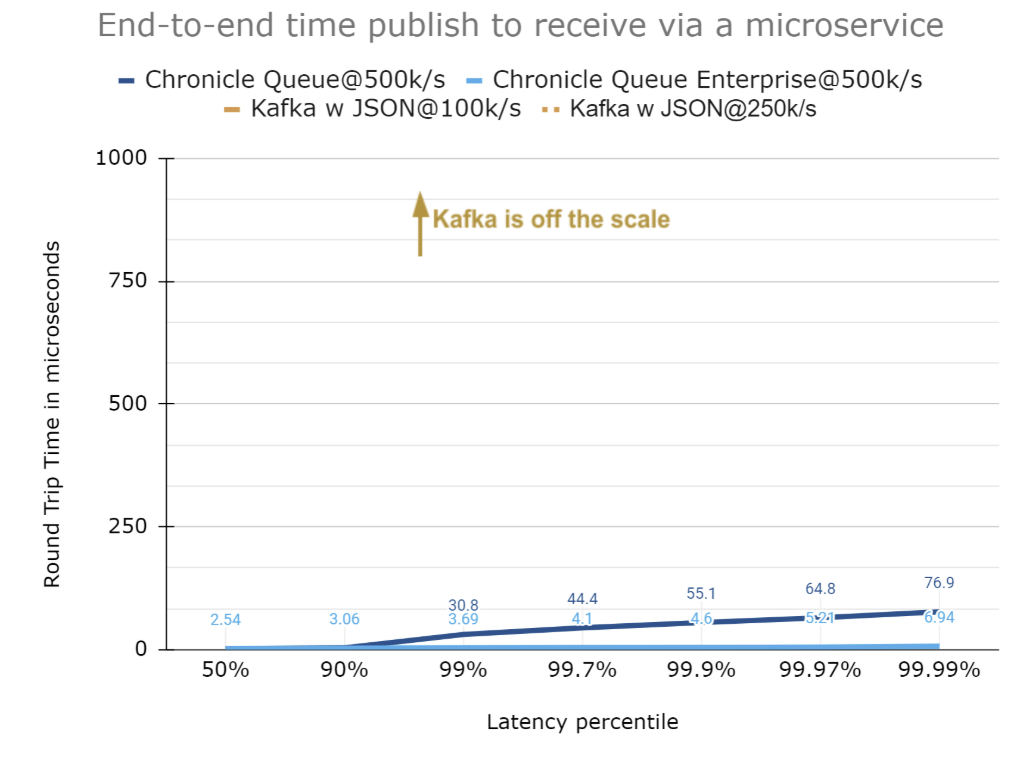
It is difficult to visualise Chronicle’s advantage on a linear scale, so each chart below expands by 10×.
• Up to 100 µs: Chronicle Queue Enterprise shows tight, consistent latencies over two hops with serialization. Chronicle OS remains close but with larger outliers. Kafka does not appear at this scale.
• Up to 1 000 µs: Chronicle maintains consistency to the 99.99th percentile; Kafka remains off-scale.
• Up to 10 000 µs: Kafka finally appears. At 100 k msg/s (200 k msg/s total) its 99th-percentile latency is about 2 630 µs, matching Confluent’s 5 ms single-hop figure.
How much higher are Kafka latencies?
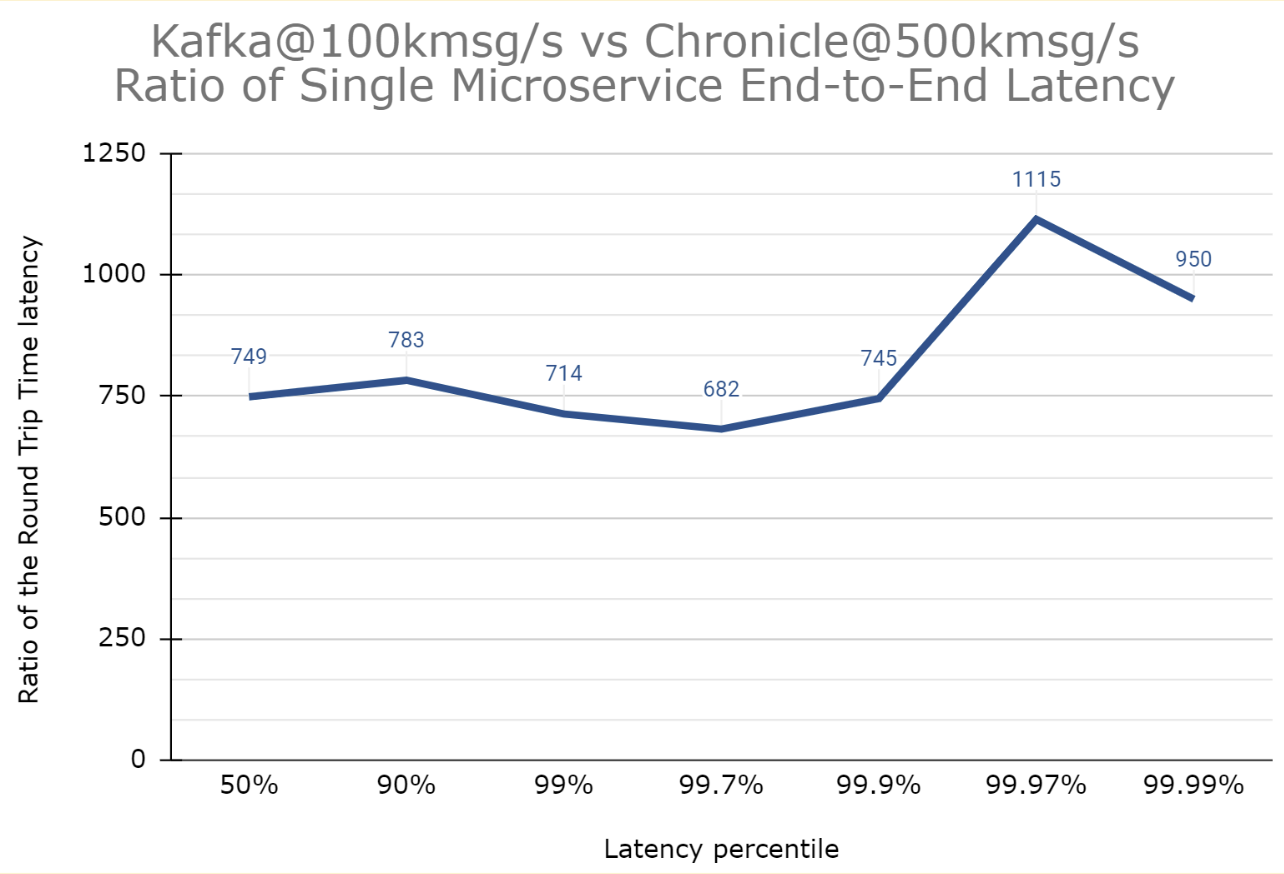
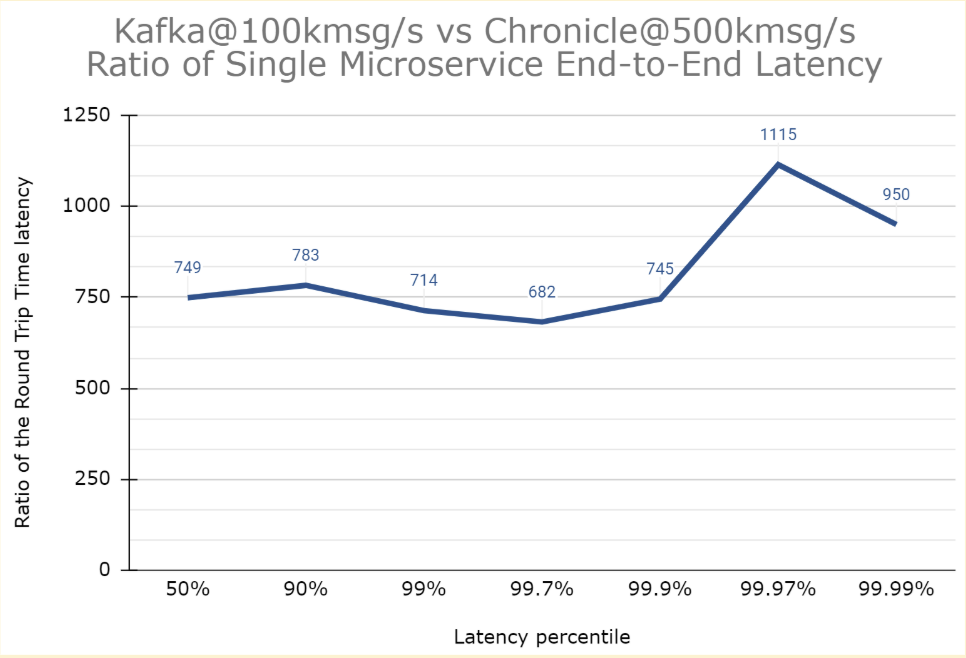
Plotting the latency ratio of Kafka @ 100 k msg/s against Chronicle Enterprise @ 500 k msg/s (five times the load) shows Kafka is at least 680× slower across the distribution.
Kafka needed four partitions and eight microservices for its best result, whereas Chronicle Queue required only one of each.
Heap usage
Chronicle Queue
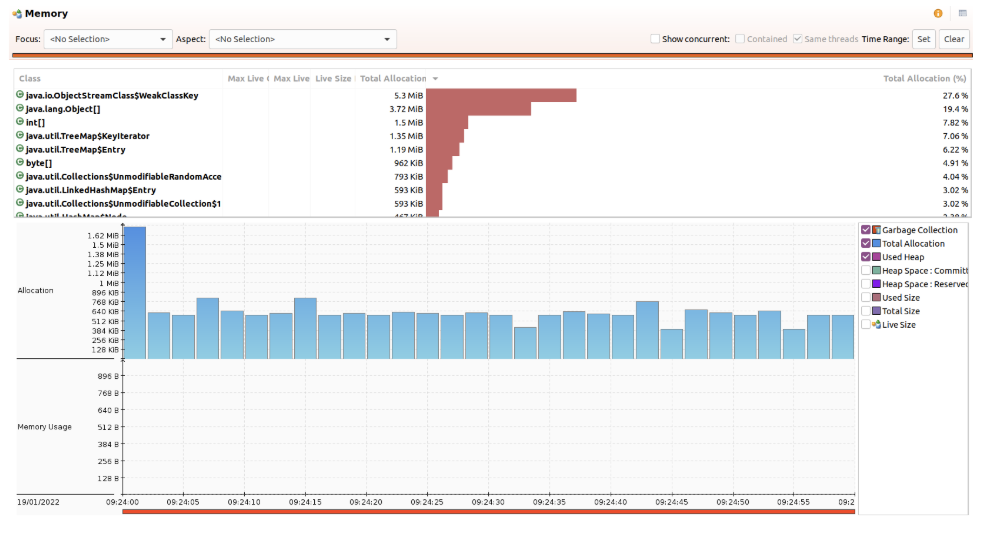
At 500 k msg/s for five minutes (300 million messages), Chronicle Queue peaked at 40 MB heap under the G1 collector with default settings. The JVM ran with a 32 MB heap and triggered no GCs after warm-up. Most garbage originated from Java Flight Recorder; Chronicle Queue avoids standard Java serialization.
Kafka
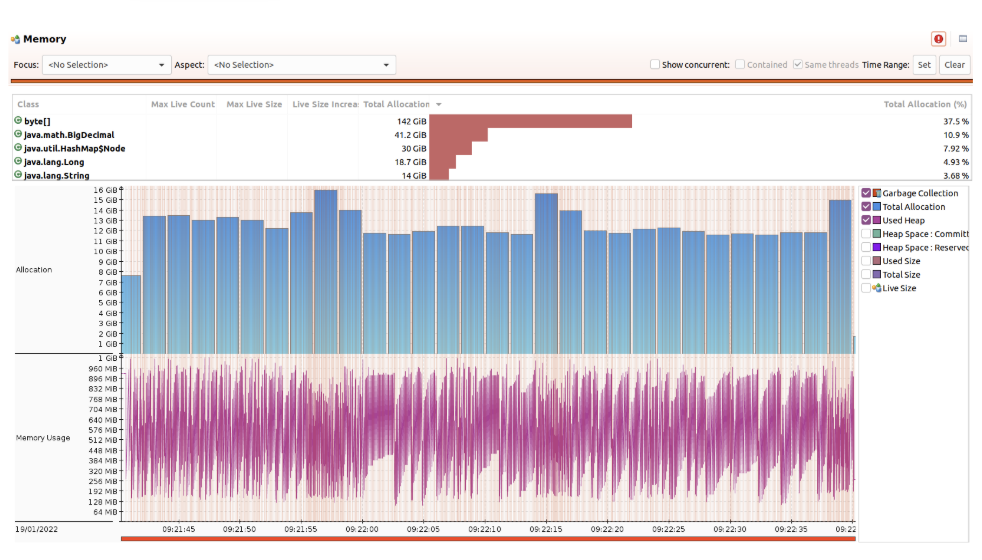
Running at 250 k msg/s for 10 minutes (300 million messages) pushed Kafka’s heap to 2.87 GB, causing 2 410 young-generation pauses and 182 concurrent cycles after warm-up. Reducing the heap to 128 MB caused more than 139 k GCs – clearly sub-optimal.
Conclusion
Kafka excels at log aggregation but often misses the microsecond-level latency targets modern microservices demand. In our tests:
• Chronicle OS held end-to-end latencies under 100 µs for more than 99.99 percent of messages, even at 500 k msg/s.
• Chronicle Enterprise pushed consistency further, keeping 99.99 percent of latencies below 10 µs.
• Kafka exhibited 7 ms outliers at one-fifth of Chronicle’s throughput.
For organisations building ultra-low-latency, high-throughput microservices, Chronicle Queue offers a deterministic, high-performance alternative to Kafka.