
Cloud-Native Chronicle Deployment
April 6th, 2022
Traditionally, companies with low-latency requirements deployed to bare metal servers, eschewing the convenience, elasticity and programmability of modern cloud computing, virtualisation and containerisation in an effort to squeeze maximum performance and minimal latency from “on-premises” (often co-located) hardware. For many of these latency sensitive workloads — including trading systems, real-time analytics, and high-frequency event management pipelines — every microsecond counts, so bare metal used to feel like the only viable option.
More recently, these companies are increasingly moving to public and private “cloud” environments, either for satellite services around their tuned low-latency/high-volume (LL/HV) systems or in some cases for LL/HV workloads themselves. A mature cloud architecture, built on microservices architecture and event driven architecture principles, lets teams compose independent services that can be deployed, updated and scaled quickly. That flexibility has led to an explosion in cloud native applications that still meet stringent performance goals.
This demo implements a replicated Chronicle Queue in a typical cloud native environment. The solution implements active/passive redundancy and automated fail-over driven by Consul service registry health checks, delivering real time resilience that security teams and operations teams often seek in areas such as threat detection investigation or security event management. Live metrics are exposed using Prometheus Grafana visualisations so that engineers can observe latency, throughput and other key performance indicators at a glance.
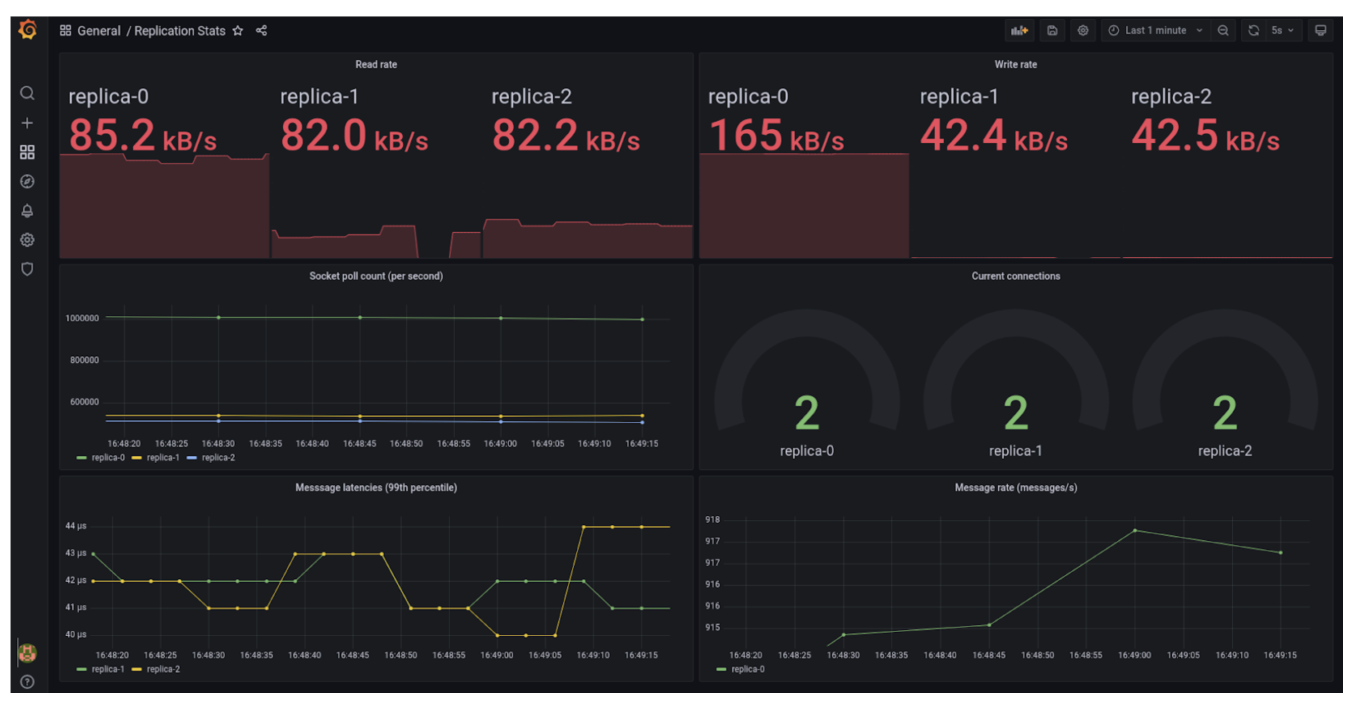
Figure 1: Metrics Panel – On the test device (an i9 laptop with NVME SSD running Minikube with the Docker driver) we see 99th percentile write-to-read latencies in the order of 40 µs (measured from leader to follower). This performance could be improved considerably but no effort was made to tune the deployment or example code as performance tuning is out of scope for this article. Nevertheless, the numbers underline that cloud native security or SIEM SOAR style platforms do not have to compromise on speed.
Benefits and Challenges
Cloud native environments offer a common platform and interfaces to ease definition and deployment of complex application architectures. This infrastructure enables the use of mature off-the-shelf components to solve common problems such as leader election, service discovery, observability, health-checks, self-healing, scaling, data retention and configuration management. Those same capabilities are the foundation of many security operations google teams rely on for continuous threat intelligence feeds, automated detection investigation response workflows and large-scale data ingestion pipelines.
Typically the pattern has been to run containers atop virtual machines in these environments; however, now all the main cloud providers offer bare-metal (or near bare metal) solutions, so even latency sensitive workloads such as detection engines or time-critical risk calculations can be hosted in the cloud without sacrificing performance.
This is the first iteration of a demonstration of how Chronicle products can be used in these architectures and includes solutions to some of the challenges encountered by our clients in cloud and other environments. By leveraging common infrastructure solutions we can marry the strengths of Chronicle products with the convenience of modern production environments to provide simple low latency, operationally robust systems that align with best-practice cloud native security expectations and the broader goals of Google security operations style deployments.
The Solution
The demo consists of a set of nodes in a cluster of configurable (and dynamic) size. We chose Kubernetes for the demo because it’s the de-facto standard for cloud native infrastructure, however most orchestration platforms implement similar features. For production, many operators choose Google Kubernetes Engine for its integrations google with underlying Google Cloud networking, observability and security event tooling.
Each node in the cluster contains some toy business logic which stores its state in a replicated Chronicle Queue, creating an event driven data ingestion stream that can later feed downstream analytics or machine learning models.

Figure 2: A diagram of a single pod, showing the important containers and volumes
The nodes in the cluster each maintain a copy of a Chronicle Queue; the copies are kept in sync by Chronicle Queue Enterprise replication. At any given time, one of the nodes is set as the “leader” node; the leader is responsible for populating the queue according to some business process. When the current leader node fails or is removed from the cluster, one of the “follower” nodes will be promoted to leader. This is a common pattern used to implement high availability, and it mirrors approaches found in google chronicle security or chronicle security operations where a primary detection engine hands over instantly to a replica to preserve real time monitoring.
The cluster nodes register themselves with the Consul service registry and configure a simple health check that monitors the node’s health by polling its metrics endpoint over HTTP. In a production deployment, this health check might be more sophisticated, including security event probes or automated investigation response hooks.
Each node is a Kubernetes Pod in a StatefulSet. The pods each contain the following containers:
1. business-logic
This container runs the toy “business logic” that either populates or reads from the queue (depending on its role). For the purposes of the demo, the business logic layer simply writes a sequence of values to the queue when leader, and prints those sequence numbers out as a follower. In a real-world deployment, this would be a real application – for example, Chronicle FIX in HA (High Availability) mode, Chronicle Matching Engine, or a custom application that streams security event data to a google chronicle siem integration.
The cluster must nominate a single leader pod which is responsible for populating the queue, so the business logic layer engages in a Consul leader election. The pseudo-code for the business logic layer is as follows.

The business logic container reads/writes the queue from/to the “replicated state” volume. This pattern supports enormous data ingestion capacity while maintaining deterministic low latency suitable for threat detection pipelines.
2. replicator
This container runs the Chronicle Enterprise Queue replication process. It monitors the “replication config” volume for updates to the replication configuration file and when an update is detected, it restarts replication with the new configuration. If the replication configuration is not present or invalid it does not start replication. In SIEM SOAR contexts, the same mechanism could be extended to replicate security event streams across regions for compliance-driven data retention.
Restarting replication when a cluster changes is a common pattern we recommend; the restart itself happens in milliseconds, meaning interruption to replication is minimal and fully transparent to upstream detection investigation response tooling.
3. config-generator
Because we have Consul as a service registry, and our leadership election is conducted via the Consul key-value store, we can derive our replication configuration from the state of Consul alone.
This container uses Consul template to monitor Consul for changes in the cluster (e.g. addition or removal of nodes) or changes in the current leader. When any of these changes occur, the replication configuration is regenerated to the “replication config” volume, ensuring that security operations remain aligned with the live topology.
4. exporter-merger
This container runs a process to combine Prometheus metrics from the replicator and business-logic containers, giving operations google teams a unified real time view of queue replication, data throughput and end-to-end latency.
Monitoring
Consul monitors the health of containers using configurable checks. If the health checks detect that a node has failed, it relinquishes the leadership (if held) and is removed from the cluster. Kubernetes also monitors the health of each pod, and when one fails, it is shut down and another is created to take its place. These mechanisms echo the automatic remediation that google security operations promotes for mission-critical detection pipelines.
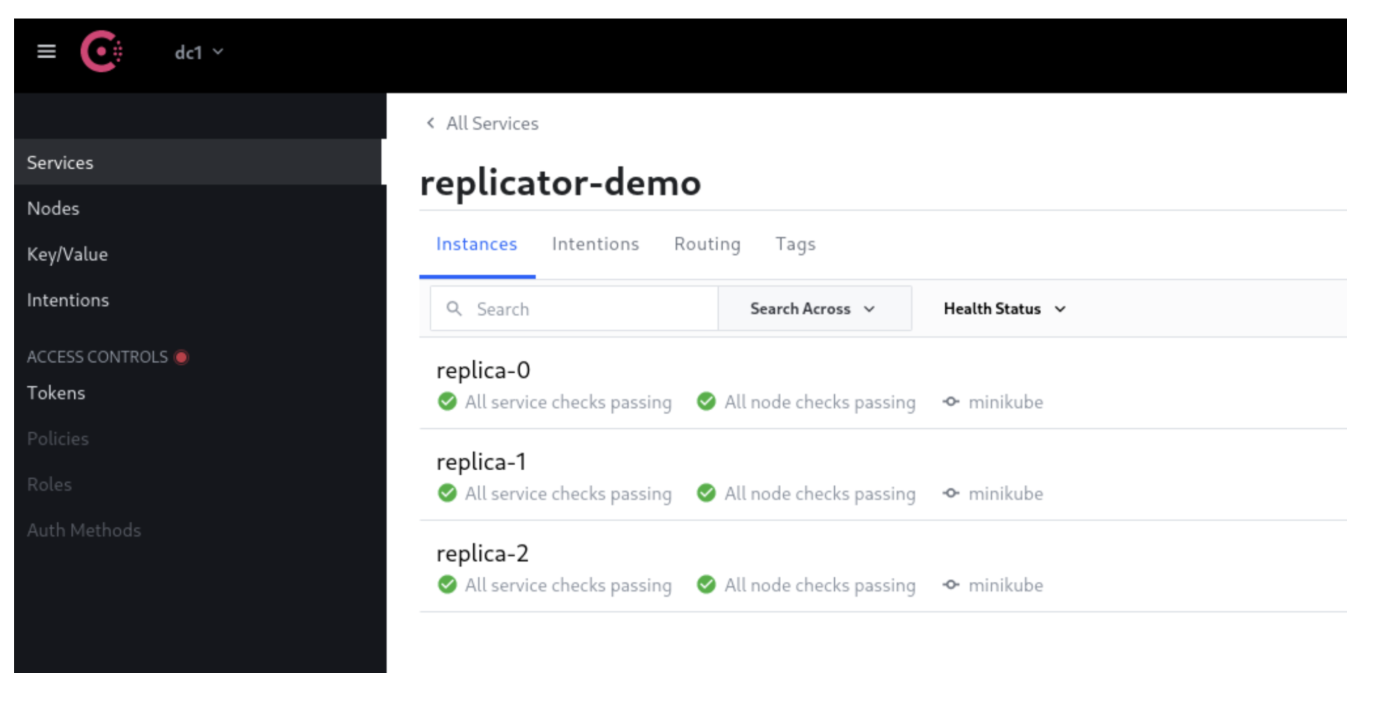
Figure 3: The Consul service registry UI showing the healthy cluster of replicas
The business-logic and replication containers both publish metrics via Prometheus to expose the state of the cluster. The metrics published via Prometheus are then rendered as a dashboard by Grafana, forming the familiar Prometheus Grafana toolchain beloved by cloud native project maintainers and security event analysts alike.
Figure 1 shows the metrics dashboard; you can see in this snapshot replica-0 was the leader and the other replicas are followers. The read rate on replica-0 is very high due to the acknowledgements coming back from the other replicas. In a threat intelligence context, similar visualisations could highlight spikes in event driven traffic or anomalies picked up by machine learning models.
Summary
Consul maintains a registry of the cluster members and our application registers health checks to evict any unhealthy nodes from that. Consul also facilitates the leader election, determining which node should be leader and which should be followers. The Chronicle Queue replication configuration is then derived from the state of the cluster in Consul, giving us a fully automated, cloud based control-plane reminiscent of google secops practices.
The demo has the following properties
When the leader node fails, a follower node is automatically promoted to be the new leader node, ensuring uninterrupted real time processing suitable for detection investigation and response workflows.
If the Kubernetes “scale” command is used to change the size of the cluster, the configuration of the nodes will automatically adjust. This scaling could also be automated in response to load, a technique widely adopted by SIEM SOAR platforms to cope with bursty security event volumes.
New nodes are discovered by Prometheus, and their metrics automatically included in the dashboard, simplifying day-two operations google teams normally wrestle with.
The fail-over occurs in approximately (time taken to detect failure, i.e. the health-check timeout) + (Time to propagate Consul state) + (TCP round-trip to the Consul server) which, in the demo environment, is dominated by the health check timeout. For more geographically distributed deployments the time to propagate Consul state would become more significant, especially when complying with regulated data retention policies.
Most of this functionality is implemented by configuration not code. There are some thin adapters plugged into standard Chronicle interfaces that enable this behaviour, demonstrating the benefits google cloud consumers gain by adopting well-defined, standards-based integration points.
Conclusion
This article demonstrates one way to deploy a dynamic, low-latency, fault-tolerant Chronicle Queue-based application into a Kubernetes cluster. The same pattern can underpin high-throughput threat detection engines, chronicle siem collectors or broader cloud native security pipelines that demand sub-millisecond responsiveness.
There are constructs in Kubernetes (StatefulSets, dynamic provisioning) and Consul (Service registry, leader election, configuration templating) that match nicely with concepts in Chronicle Queue Enterprise to greatly simplify the operational aspects of this. Similar patterns are also leveraged by google chronicle and google security products to ensure scalable, resilient security operations.
Standard Chronicle interfaces allow the publishing of key metrics to provide a live view of the state of the deployed application. By combining these interfaces with Google Cloud or on-prem bare metal deployments, organisations can achieve a harmonious blend of cloud native flexibility and deterministic performance — the very essence of modern cloud based, event driven, independent services.